Multi-Symbol Scanning
The Wedge Pattern Scanner displays all monitored symbols in a real-time table with color-coded state tracking. Every wedge is followed through its full lifecycle, from formation through breakout to confirmation or failure.
Scanner Table
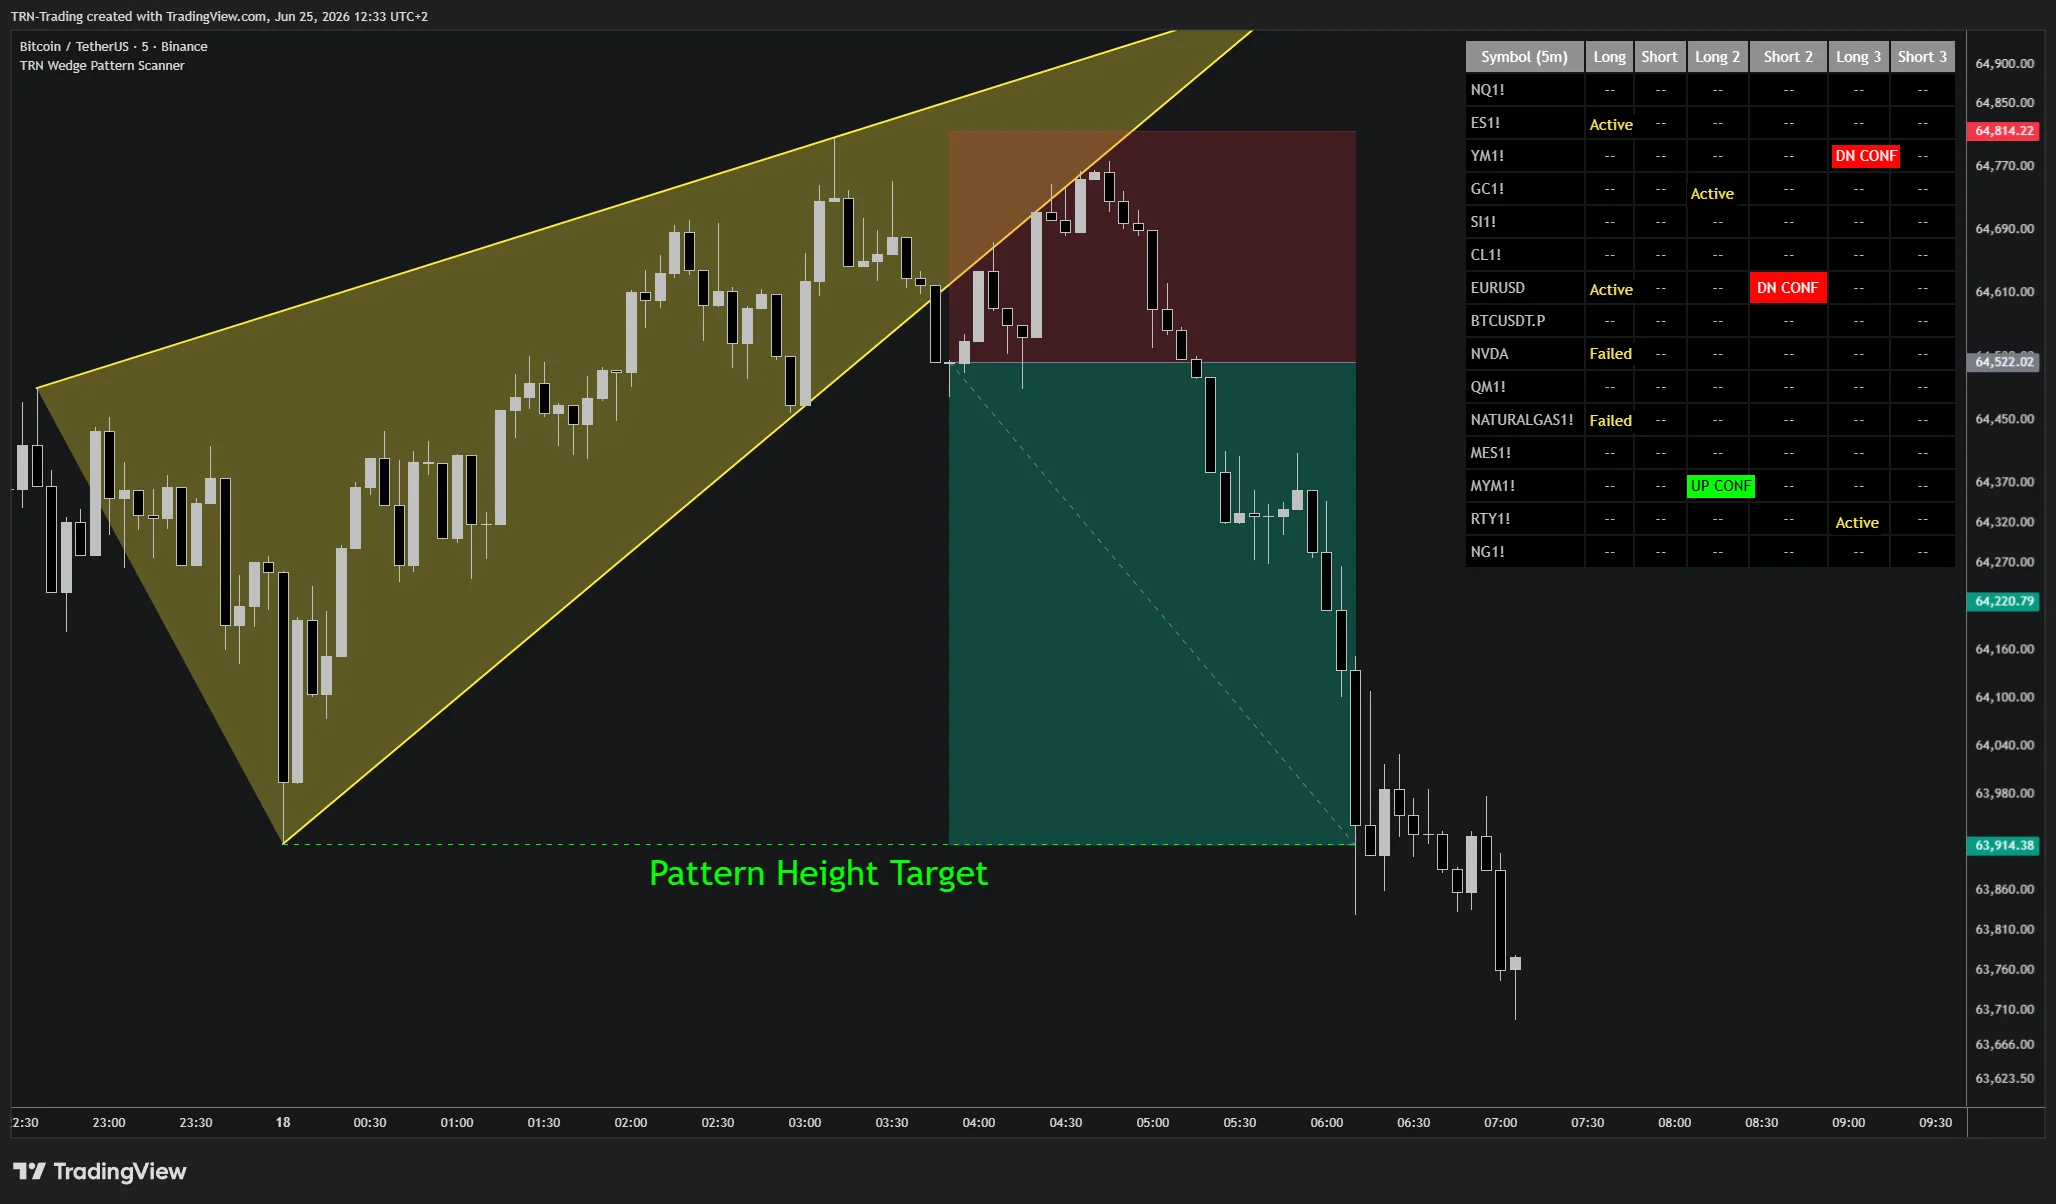
The scanner table shows two state columns per enabled detection scale. With all three scales on, that is six state columns:
| Column | What It Shows |
|---|---|
| Symbol | The instrument ticker + chart timeframe |
| Long | Bullish wedge state, Size 1 (falling wedge resolving up) |
| Short | Bearish wedge state, Size 1 (rising wedge resolving down) |
| Long 2 / Short 2 | Bullish / bearish wedge state, Size 2 (optional) |
| Long 3 / Short 3 | Bullish / bearish wedge state, Size 3 (optional) |
Pattern States
Each cell in the scanner table shows the current state of wedge detection for that symbol and direction:
| State | Color | Meaning |
|---|---|---|
-- | Gray | No active wedge |
ACTIVE | Yellow text | Wedge has formed and is compressing; waiting for the breakout |
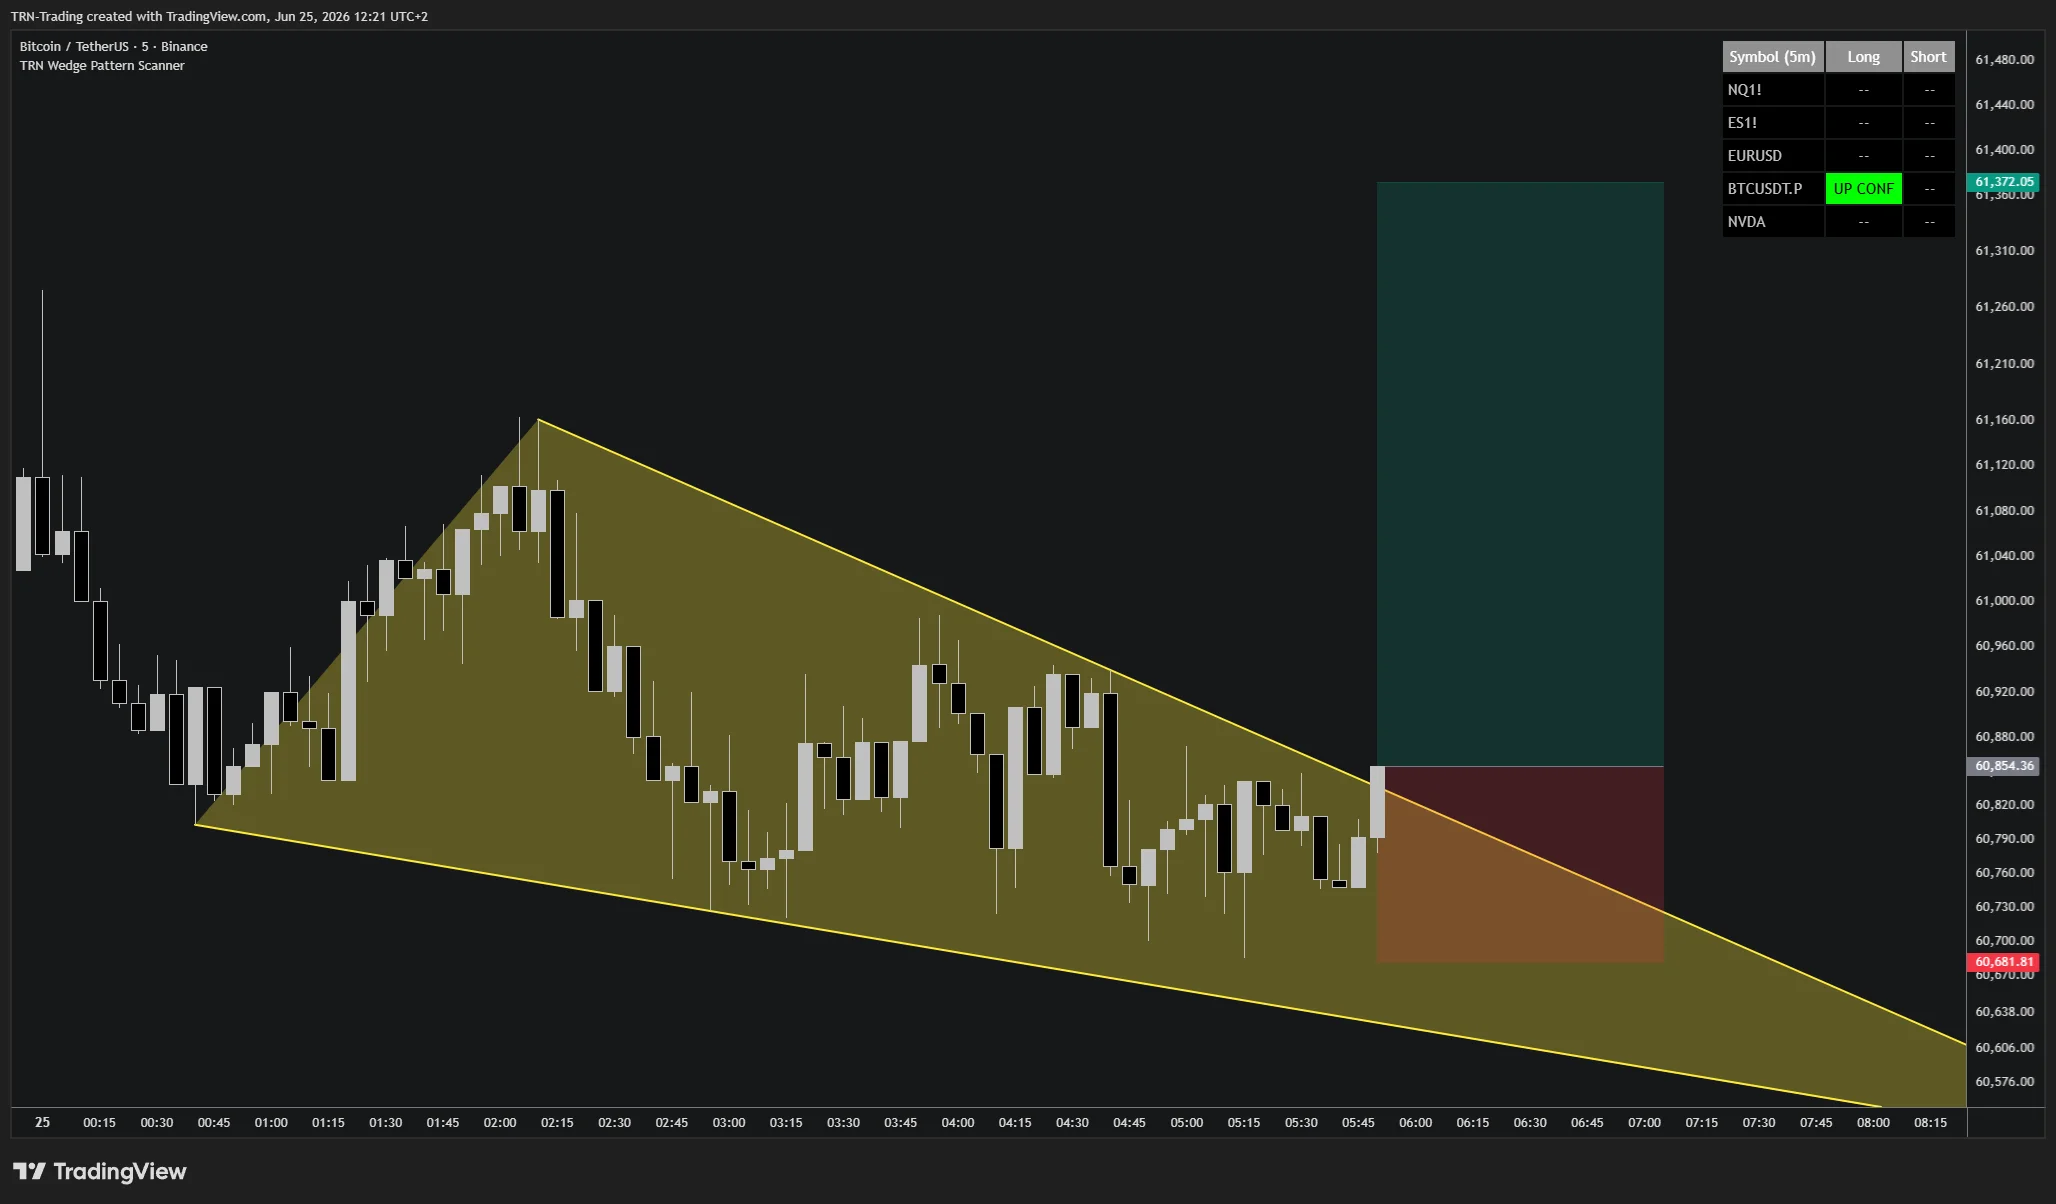
UP / DN | Green/Red text | Breakout crossed intrabar (unconfirmed by close) |
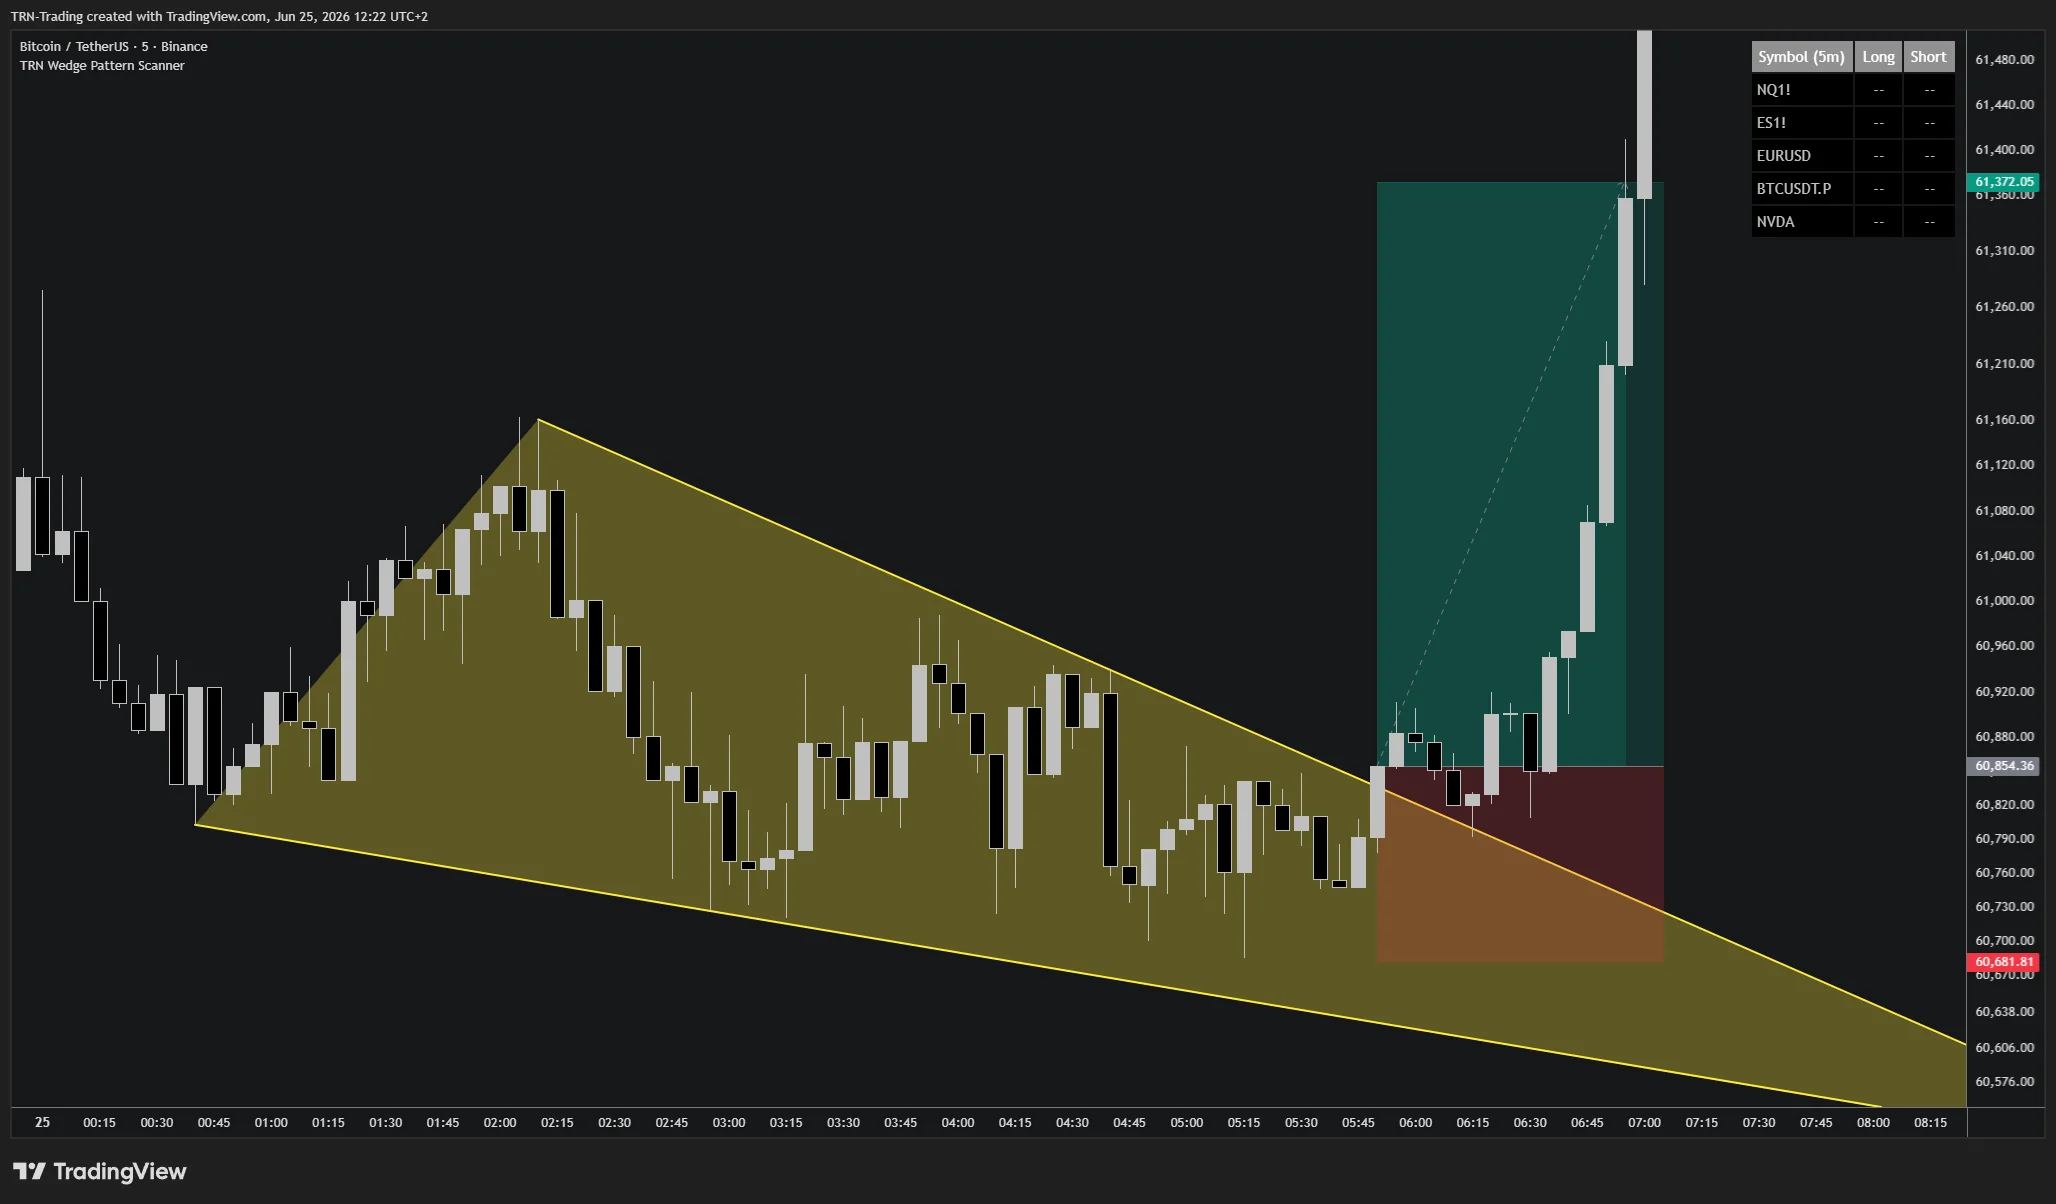
UP CONF / DN CONF | Green/Red filled cell | Next bar confirmed with a follow-through close |
FAILED | Gray | Structure broke before a clean breakout triggered |
Pattern Lifecycle
- Detection — The Wedge Pattern Scanner detects a valid converging-trendline wedge. State flips to
ACTIVE. - Breakout — Price breaks beyond a trendline. State flips to
UPorDN(unconfirmed). - Confirmation — The next bar closes beyond the trendline in the breakout direction. State flips to
UP CONForDN CONF, and the cell fills with the directional color. - Invalidation — If the structure breaks before a clean breakout, the state flips to
FAILED.
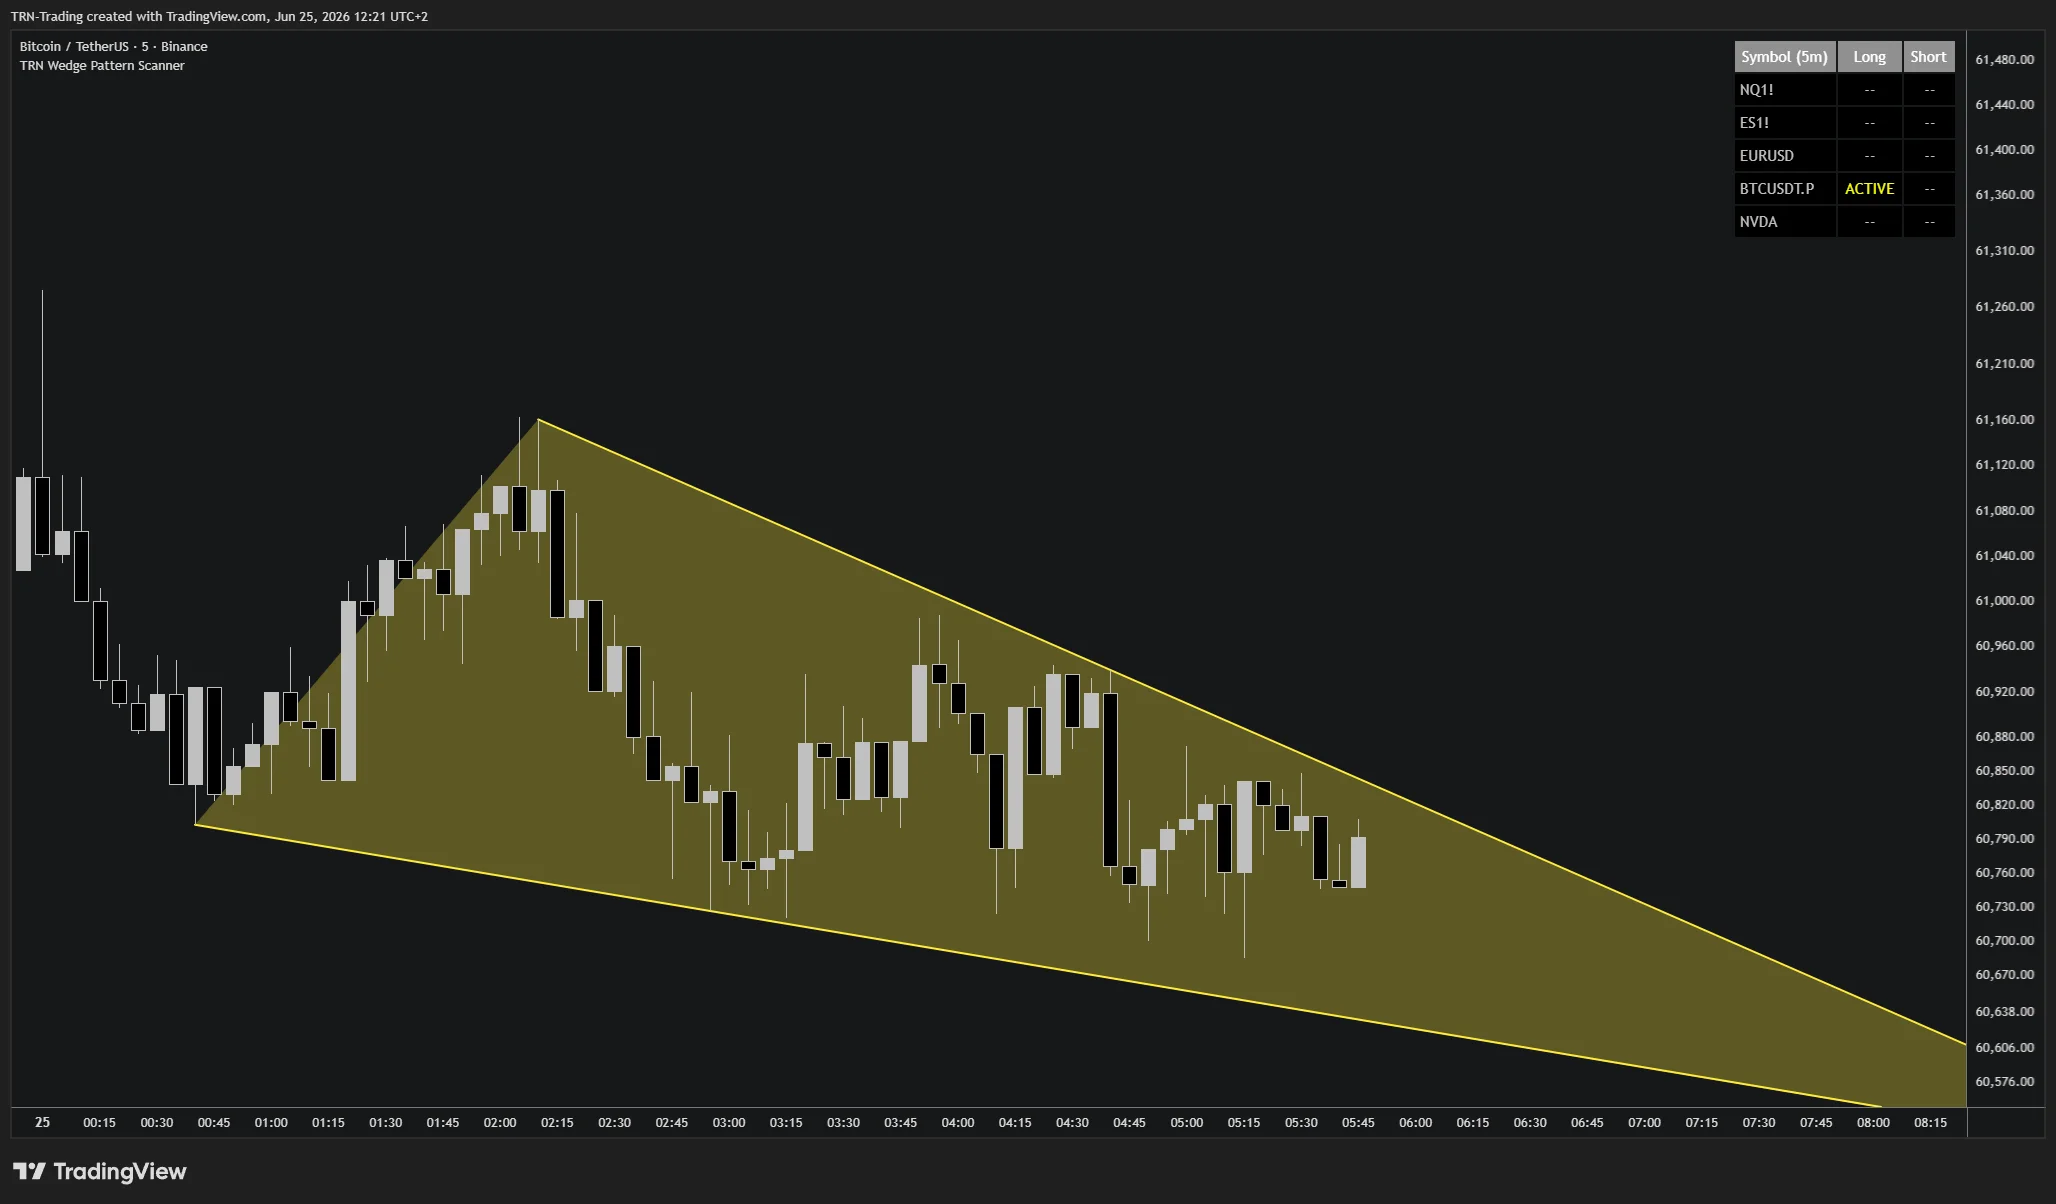
Watch for cells flipping to ACTIVE. That is the early warning that a wedge is compressing on a symbol you are not currently charting. Switch to the Wedge Pattern Pro indicator on that instrument to study the structure and prepare your order before the breakout triggers.
Three-Scale Detection
The scanner runs up to three independent detection scales concurrently. Each is tuned to a different swing size:
| Scale | Default Swing Size | What It Catches |
|---|---|---|
| Size 1 | 7 | Intraday and faster wedges, frequent setups |
| Size 2 | 14 | Mid-scale wedges |
| Size 3 | 21 | Broader, structural wedges |
All scales run on the same chart timeframe. They are not multi-timeframe in the TradingView sense, but multi-scale: three swing sensitivities operating in parallel. Each enabled scale adds its own Long/Short column pair.
When a symbol shows the same direction on more than one scale at once, that is a higher-conviction setup. The same compression is being recognized at several scales, which is signal-strength evidence beyond what any single scale provides.
Validation Filters
Every candidate wedge is validated against the same framework used by the Wedge Pattern Pro chart-level detector:
- Trendline convergence — Both trendlines must genuinely converge. Parallel channels and divergent structures are rejected.
- Per-scale max length — Each detection scale enforces its own maximum pattern length, keeping timing realistic.
- Swing-structure integrity — Invalidates the wedge the moment a swing point breaks the trendline geometry.
- Log-scale slope measurement — Slope is measured on a logarithmic price scale by default, so detection stays consistent across instruments at very different price levels.
What survives the filter is not "any two converging lines." It is wedges that pass the same quality bar a discretionary chartist would apply by hand.
FAQ
What do the different states mean in the Wedge Pattern Scanner table?
The Wedge Pattern Scanner tracks states per direction: `--` (no pattern), ACTIVE (wedge formed and compressing), UP/DN (breakout crossed intrabar, unconfirmed), UP CONF/DN CONF (breakout confirmed by follow-through close, distinct cell fill), and FAILED (structure broke before a clean breakout). Each state has its own cell color.
What is the difference between the three detection scales in the Wedge Pattern Scanner?
Each detection scale runs on a different swing size. Size 1 (default 7) surfaces smaller, faster wedges suited to intraday timing. Size 2 (default 14) and Size 3 (default 21) run on progressively larger swings to surface broader structural wedges. Every enabled scale adds its own Long/Short column pair, so the Wedge Pattern Scanner table can show up to six state columns.
How do I read the Wedge Pattern Scanner watchlist effectively?
Scan the Wedge Pattern Scanner table top to bottom. Yellow text (ACTIVE) means a wedge is compressing and waiting for the breakout, so prepare. Green or red fill (UP CONF / DN CONF) means a confirmed breakout has just triggered, so switch to that chart and execute. Gray cells with FAILED or `--` can be ignored. When a symbol shows the same direction across multiple scales, that is a higher-conviction setup.