Multi-Symbol Scanning
The ABC Pattern Scanner displays all monitored symbols in a real-time table with color-coded state tracking. Every pattern is followed through its full lifecycle — from formation through entry trigger to confirmation or invalidation.
Scanner Table
The scanner table has 3 columns when running the primary detection scale alone, or 5 columns when the secondary scale is enabled:
| Column | What It Shows |
|---|---|
| Symbol | The instrument ticker + chart timeframe |
| Long | Bullish ABC pattern state (Size 1) |
| Short | Bearish ABC pattern state (Size 1) |
| Long 2 | Bullish ABC pattern state (Size 2, optional) |
| Short 2 | Bearish ABC pattern state (Size 2, optional) |
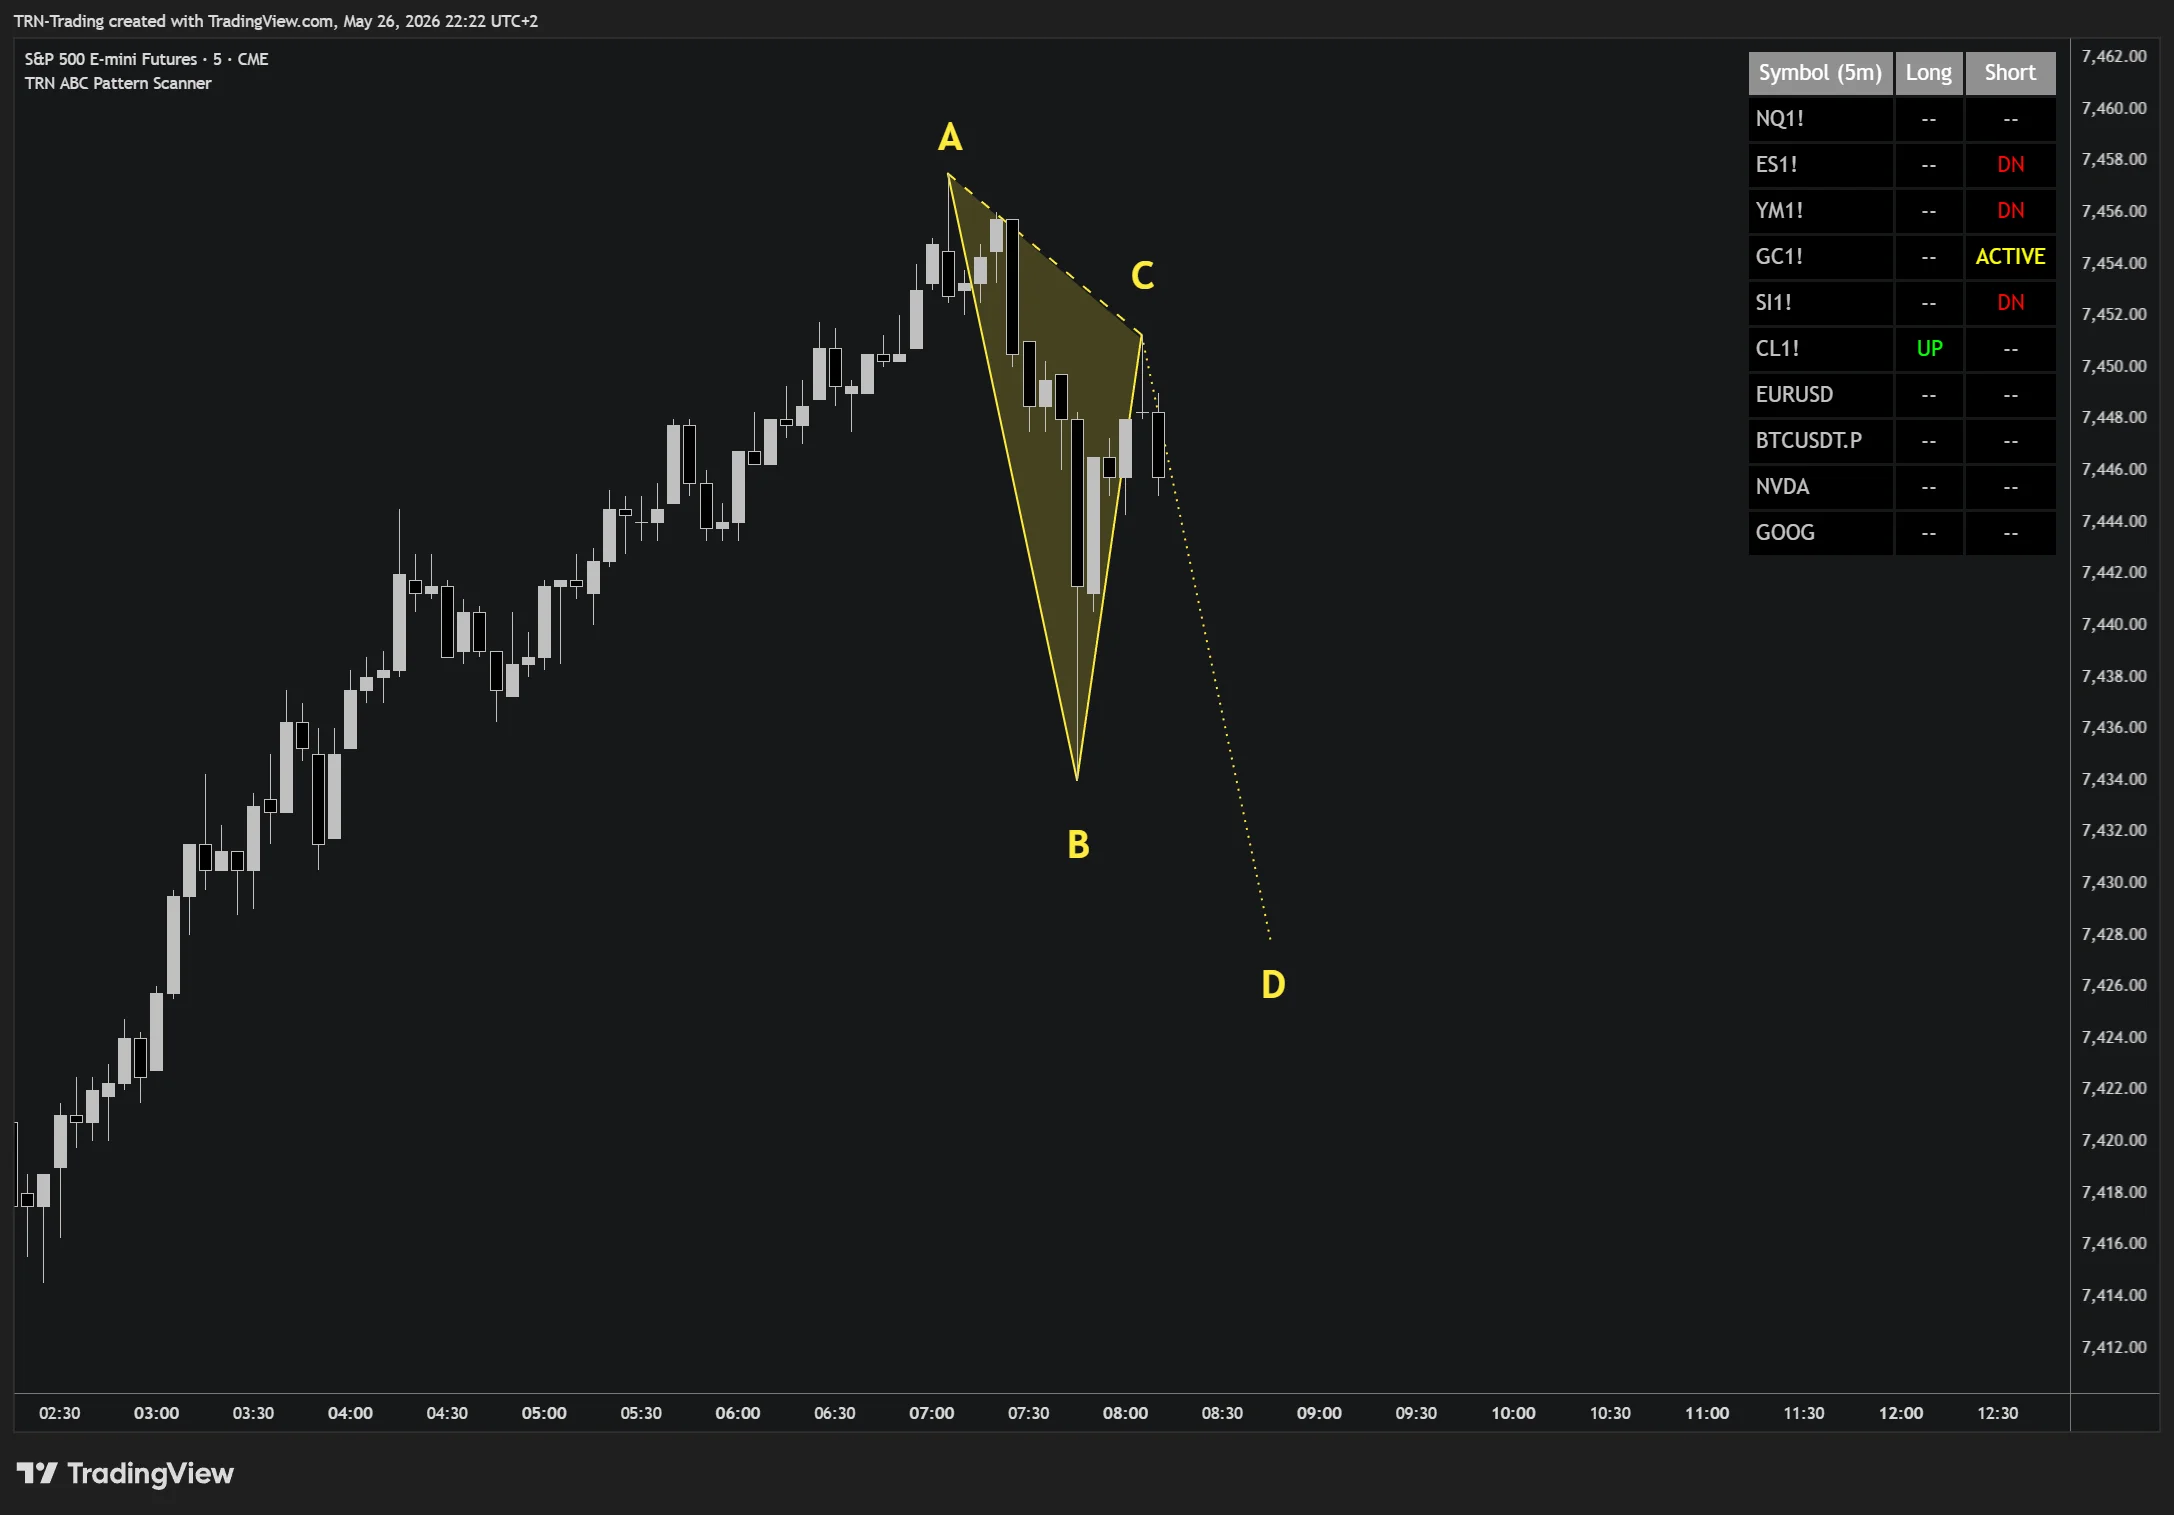
Pattern States
Each cell in the scanner table shows the current state of ABC pattern detection for that symbol and direction:
| State | Color | Meaning |
|---|---|---|
-- | Gray | No active pattern |
ACTIVE | Yellow text | Three-point ABC structure has formed; waiting for entry trigger |
UP / DN | Green/Red text | Entry trigger crossed intrabar (unconfirmed by close) |
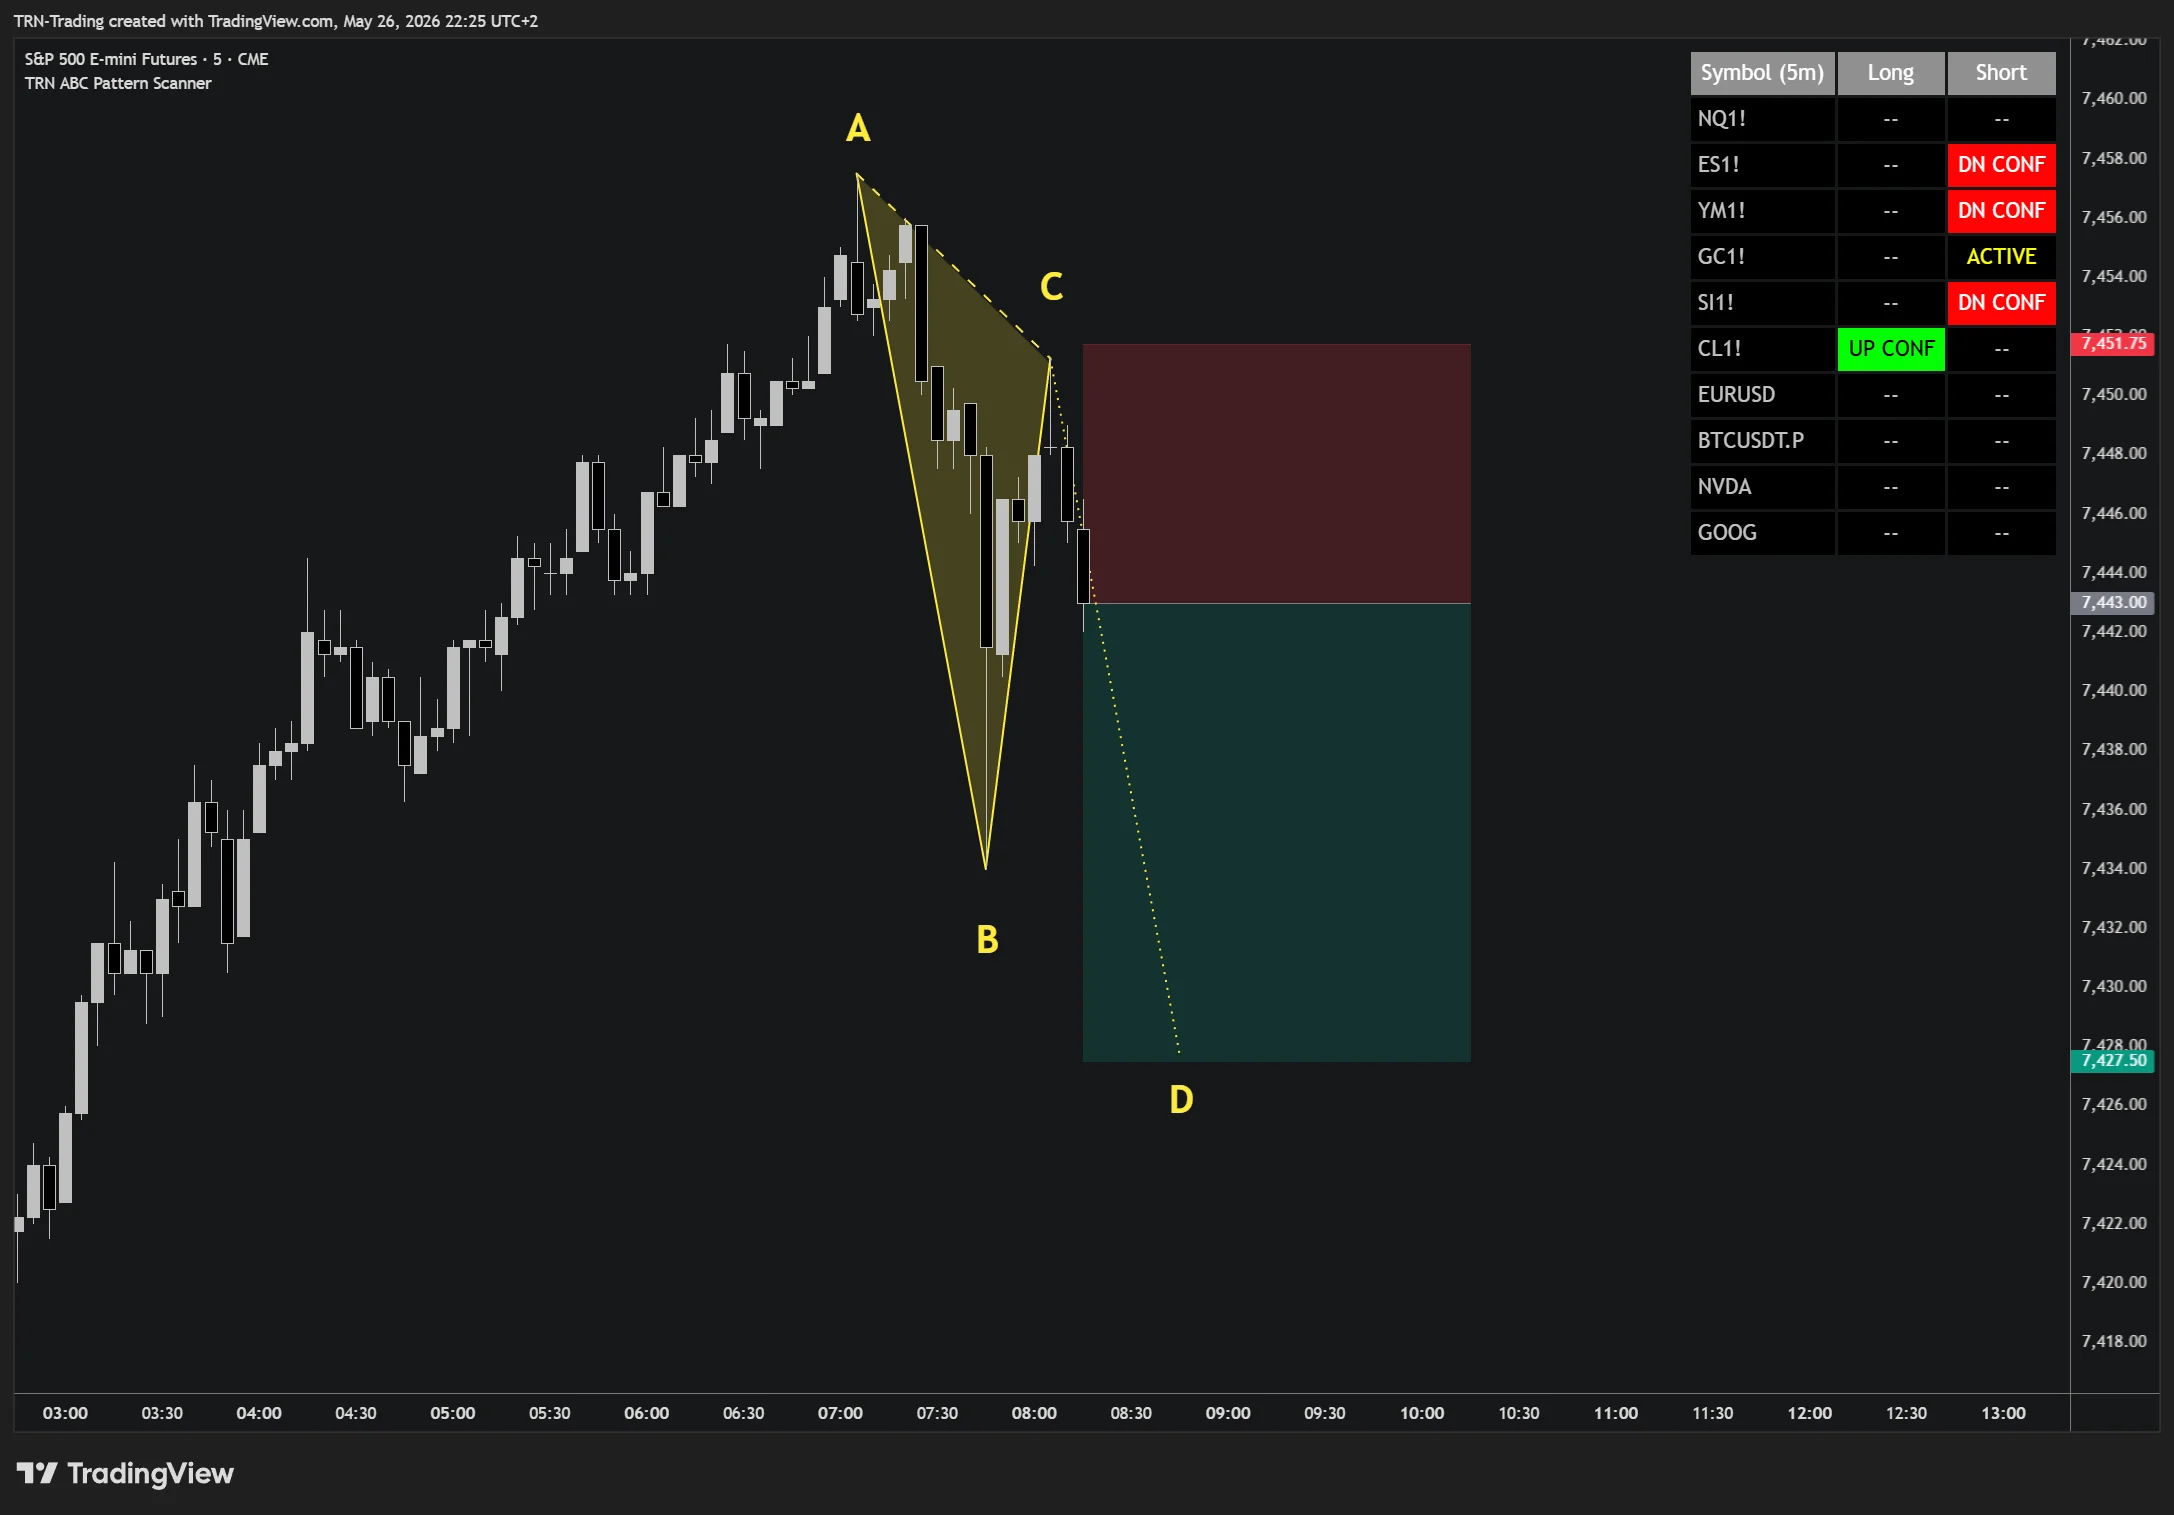
UP CONF / DN CONF | Green/Red filled cell | Next bar confirmed with follow-through close — entry has fired |
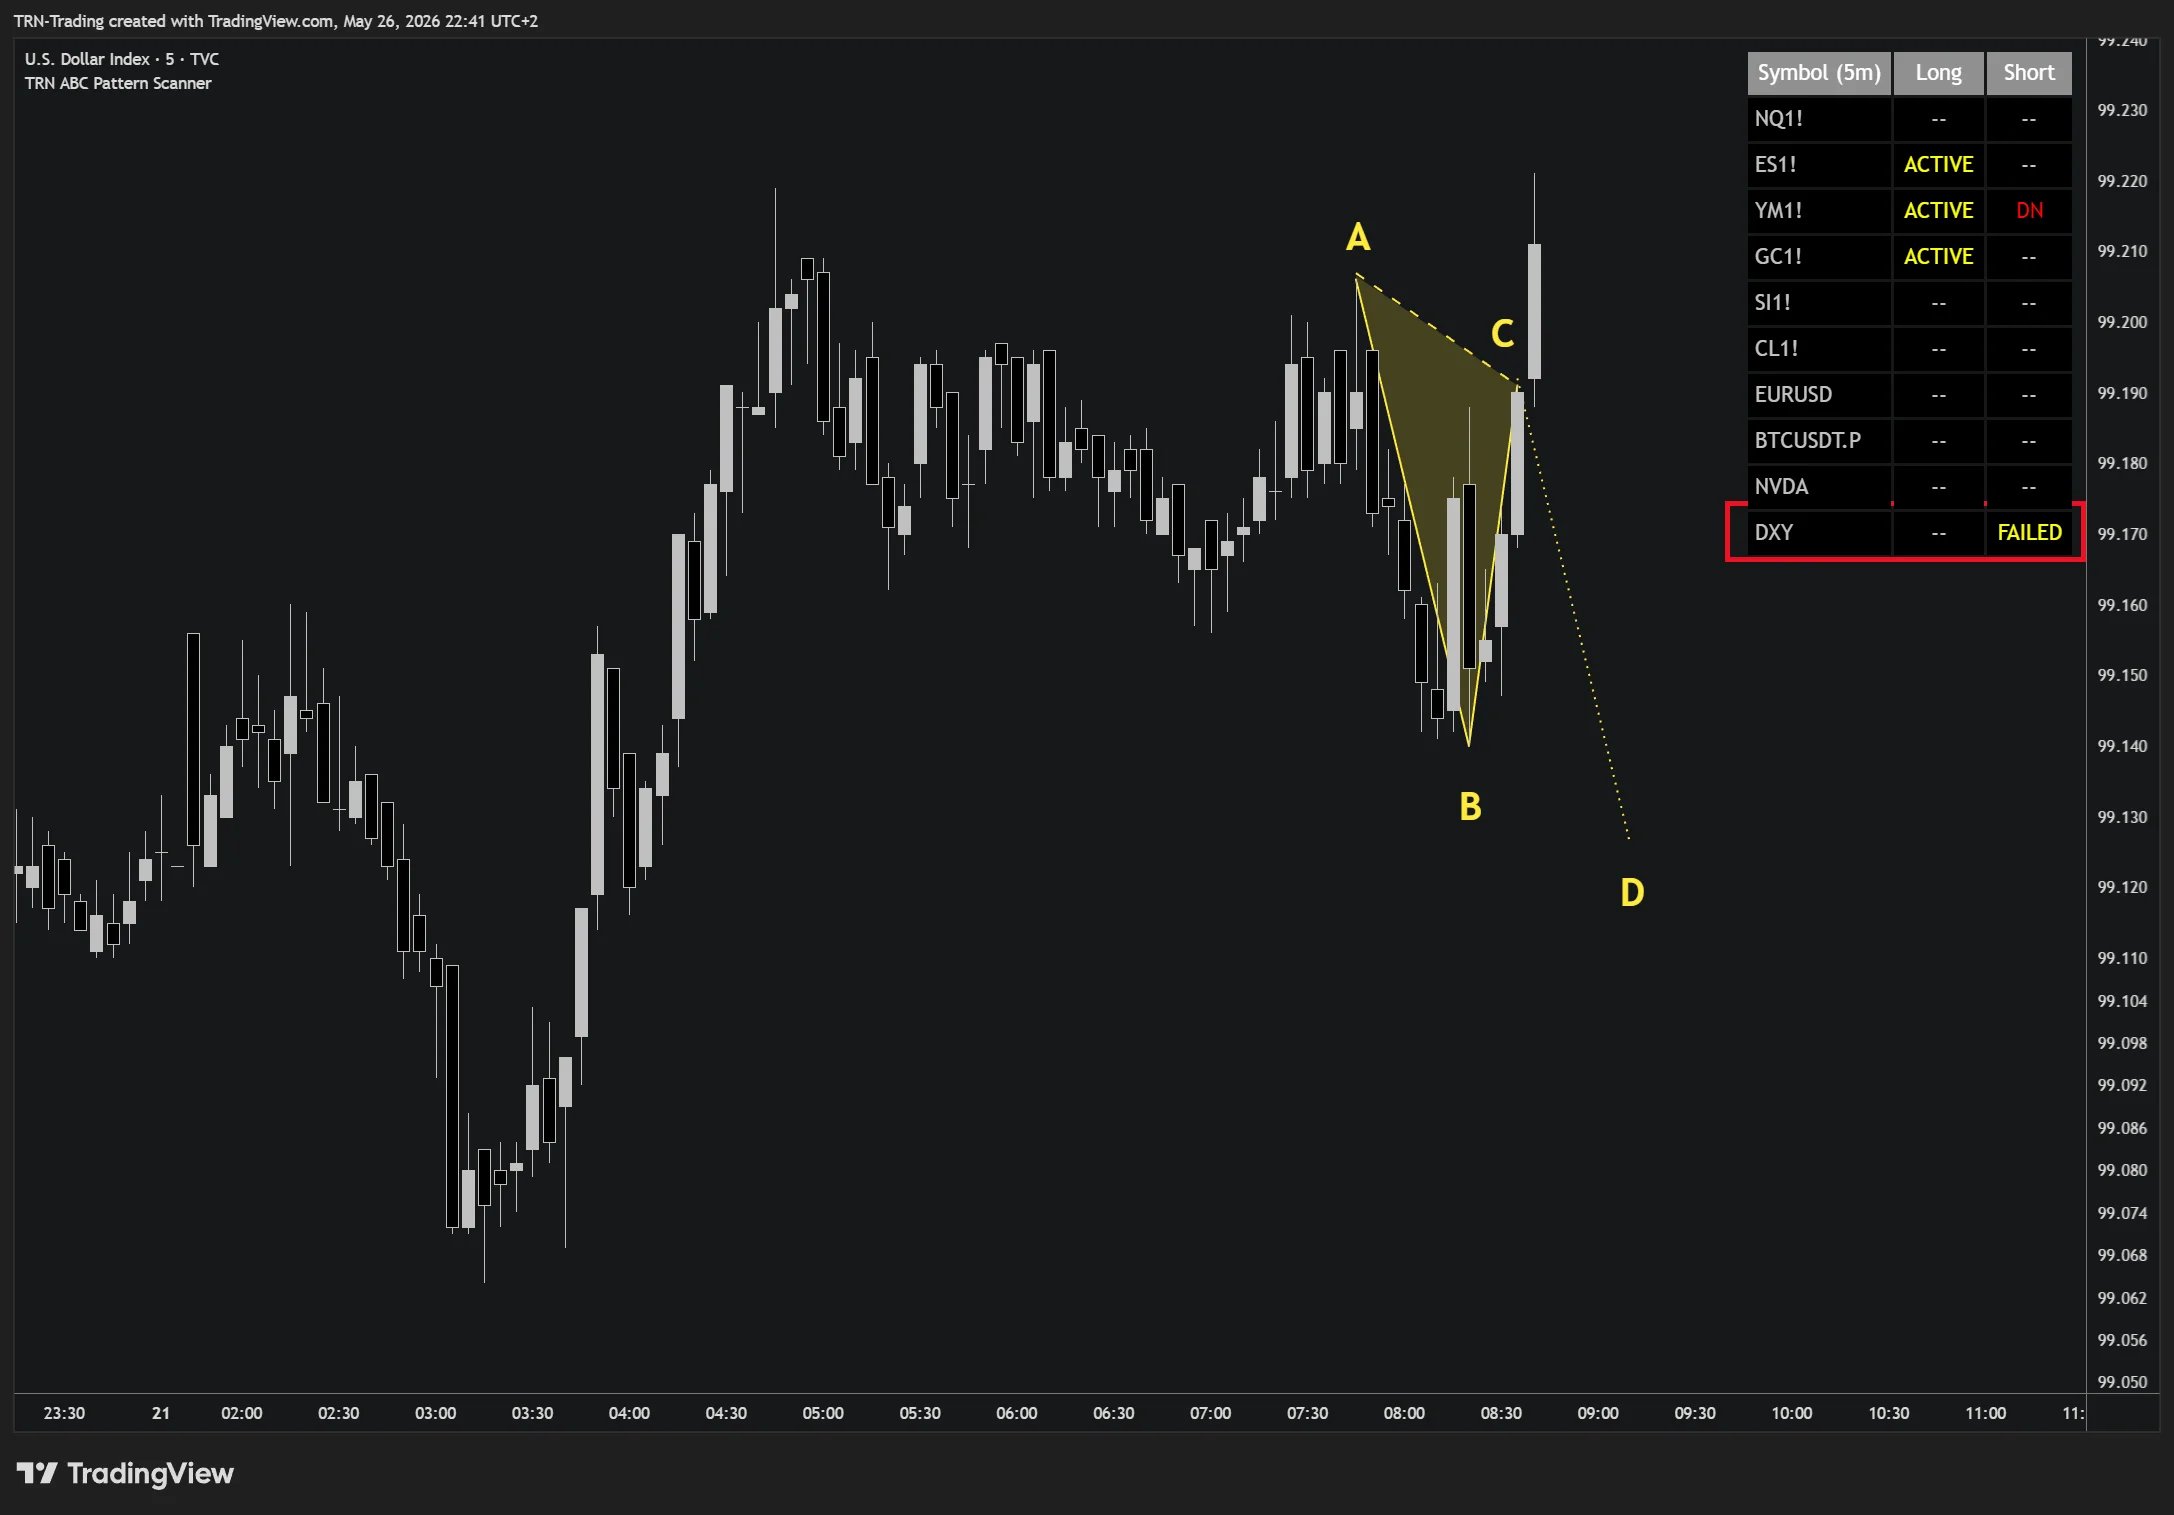
FAILED | Gray | Pattern structure broke before entry triggered |
Pattern Lifecycle
- Detection — The ABC Pattern Scanner detects a valid ABC three-point structure with C retracing into the configured Fibonacci range. State flips to
ACTIVE. - Entry Trigger — Price crosses the configured entry trigger (the C confirmation bar's high/low, or a configured retracement of the BC leg). State flips to
UPorDN. - Confirmation — The next bar closes in the trade direction beyond the trigger level. State flips to
UP CONForDN CONF. The cell fills with the directional color. - Invalidation — If the structure breaks before the entry triggers (e.g., a new swing low forms below A on a long setup), the state flips to
FAILED.
Watch for cells flipping to ACTIVE. That's the early warning that an ABC pattern is forming on a symbol you are not currently charting. Switch to the ABC Pattern Pro indicator on that instrument to validate the A-B-C structure and prepare your order before the entry triggers.
Dual-Layer Detection
The scanner runs two independent detection scales concurrently when Use Second Detection Scale is enabled:
| Scale | Default Swing Size | What It Catches |
|---|---|---|
| Size 1 | 7 | Intraday and faster ABC corrections — frequent setups |
| Size 2 (optional) | 14 | Broader, structural pullbacks — fewer but larger setups |
Both scales run on the same chart timeframe — they are not multi-timeframe in the TradingView sense, but multi-scale: two different swing sensitivities operating in parallel. When Size 2 is on, the table grows two additional columns so both scales display side by side.
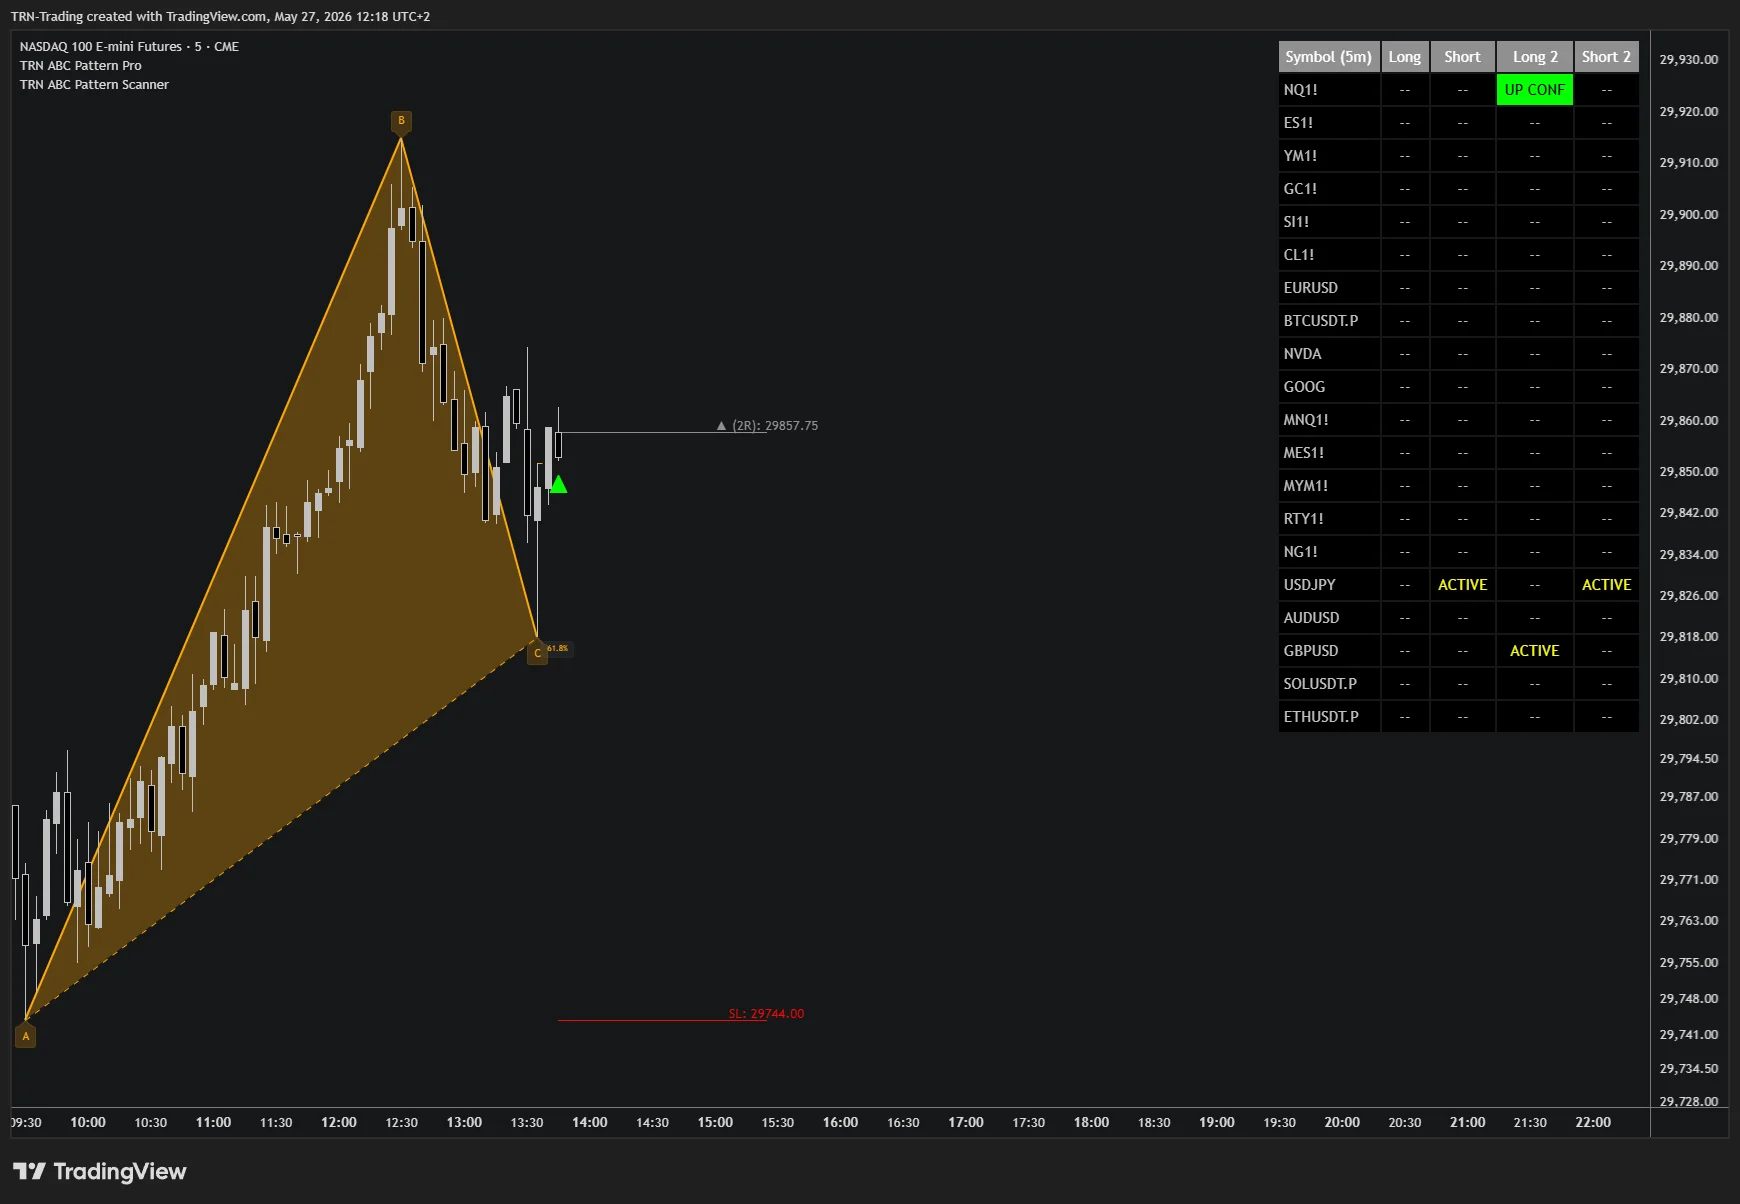
When a symbol shows an active pattern on both Size 1 and Size 2 simultaneously (or both reach UP CONF together), that is a higher-conviction setup. The same ABC structure is being recognized at two different scales — signal-strength evidence beyond what either scale alone provides.
Validation Filters
Every candidate ABC pattern is validated against the same multi-criteria framework used by the ABC Pattern Pro chart-level detector:
- Fibonacci retracement range — Point C must retrace within a configurable percentage of the AB leg (50%–88.6% by default). Patterns outside the range are rejected.
- Optional time symmetry filter — Rejects patterns where the BC leg duration is disproportionate to the AB leg.
- Swing-structure integrity — Invalidates the pattern the moment the underlying geometry breaks.
What survives the filter is not "any three random points" — it is corrections that pass the same quality bar a discretionary chartist would apply by hand.
FAQ
What do the different states mean in the ABC Pattern Scanner table?
The ABC Pattern Scanner tracks six states per direction — `--` (no pattern), ACTIVE (three-point structure formed, waiting for entry), UP/DN (entry trigger crossed intrabar, unconfirmed), UP CONF/DN CONF (entry confirmed by follow-through close, distinct cell fill), and FAILED (structure invalidated before entry triggered). Each state has its own cell color.
What is the difference between Size 1 and Size 2 in the ABC Pattern Scanner?
Size 1 (default 7) is the primary detection scale — it surfaces shorter, more frequent ABC corrections suited to intraday timing. Size 2 (default 14, optional) is a parallel detection scale running on larger swings — it surfaces broader, structural pullbacks. When Size 2 is enabled, the ABC Pattern Scanner table grows two additional columns (Long 2, Short 2) so both scales display side by side.
How do I read the ABC Pattern Scanner watchlist effectively?
Scan the ABC Pattern Scanner table top to bottom. Yellow text (ACTIVE) means a pattern is forming and waiting for entry — prepare. Green or red fill (UP CONF / DN CONF) means a confirmed entry has just triggered — switch to that chart and execute. Gray cells with FAILED or `--` can be ignored. Run Size 2 in parallel to see when intraday and higher-timeframe ABCs align — those are the highest-conviction setups.